
In the right place, all the time
How we taught our switchgear to hear faulty motors from the comfort of its cabinet.
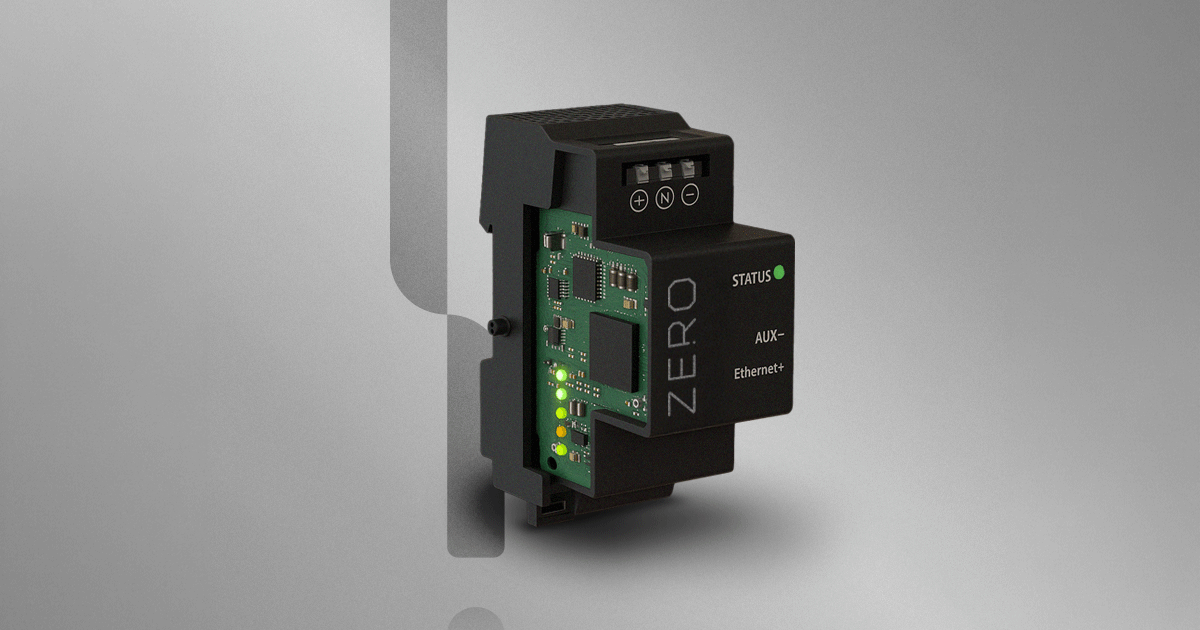
The Blixt Zero®. The sensor was never bolted onto the motor; it was in the cabinet all along.
01
An Internet of Things recap
A decade ago the pitch was everywhere. Industrial IoT was going to end unplanned downtime. In many factories, the pilots never scaled. Extra sensors were costly to fit, awkward to maintain and often too noisy to trust. Even where the idea was sound, the deployment often failed.
The economics never went away. Penrose (2008) put annual maintenance-and-reliability spend near $1 trillion, with $500–750 billion of it lost to reactive, incorrect or excessive practices. On a production line, one unplanned failure can idle everything downstream at tens of thousands of dollars an hour. In tightly coupled industries such as automotive, the cost can reach millions (Siemens, 2024).
If the cost of not knowing is that high, why is knowing still hard?
A developing motor fault can leave a warning before the motor quits. A worn bearing, a misaligned shaft or degrading insulation can change the motor's magnetic behaviour and leave a fingerprint in the supply current. The motor is its own sensor; you listen through the wire.
That idea is not new, and we certainly did not invent it. For Blixt, the opportunity is to make that listening part of the switchgear itself.
02
Standing on the shoulders of MCSA
The method is Motor Current Signature Analysis (MCSA), or Electrical Signature Analysis (ESA) when voltage is included. We build on four decades of careful work by people who mapped the physics long before we showed up. The key references are listed at the end.
If the theory has been established since the 1980s, why is this not standard on every motor?
Because applying it outside the laboratory is hard. The useful signatures are tiny: faint neighbouring frequencies, called sidebands, that can sit 50–70 dB below the main supply tone. A whisper next to a jet engine. For most of that history, the practical way to catch them was a clip-on inductive current clamp. It is a sensible tool, but it is extra hardware to carry, install and maintain, and its measurement characteristics matter when the signal of interest is so small. Portable analysers also made checks periodic: a brief capture every now and then by a technician walking the plant. Permanently installed ESA systems now offer continuous monitoring too. Blixt's approach builds the measurement into the device that switches and protects the circuit.
03
What changes when the switchgear is the sensor
A conventional circuit breaker was never expected to send detailed telemetry. It is a spring and a strip of metal. Blixt Zero® is solid-state switchgear: to switch and protect a circuit in microseconds it measures current through an inline shunt, and it records voltage as well.
For ESA, that means the measurement is a side effect of the switchgear doing its primary job. No separate clamp. No retrofit at the motor. No travelling expert with a portable analyser.
That changes the practical economics of the field:
! No separate current sensor. Every circuit protected by a Zero already has an inline measurement point.
! Continuous, not periodic. The signal is available whenever the motor runs, rather than once a quarter.
! Voltage and current together. The channels can be time-aligned for full ESA, opening possibilities beyond current-only MCSA diagnostics.
! No access to the motor required. The sensing point sits in the switchgear cabinet, which matters for sealed, submerged or hazardous-area equipment.
! Programmable power. The same device that records a test can turn it on or off on cue and capture the motor's inrush or coast-down. The instrument can run the experiment as well as observe it.
This is Blixt's advantage in predictive maintenance: the measurement point is part of equipment the customer already needs, in a cabinet that is already there.
04
The technical problems
A clean signal is only the start. Three main problems stand between a raw waveform and a useful verdict, and this is where the project actually lived.
First: the fault whisper hides behind the mains scream. Our first spectrum looked bleak: one colossal spike at 50 Hz, a picket fence of harmonics and, somewhere underneath, the fault a hertz or two from the loudest part of the signal. The challenge is to reduce that dominant mains structure without erasing the faint signatures beside it. A spectrum can look beautifully clean and still have lost the evidence we needed. The processing has to preserve those small differences well enough for the next stage to measure them. Once the mains structure is reduced by tens of decibels, the residual starts to reveal the motor.
Hearing versus listening. The top panel is the raw current from one faulty motor, dominated by 50 Hz and its harmonics. In the lower panel, that interference has been reduced so that weaker signatures can be examined where the fault physics predicts them.
Second: you cannot look everywhere, and you should not. Bearing and alignment faults leave signatures whose locations depend on the motor's geometry, supply frequency and actual running speed. Physics tells us where to look, but those addresses need the right coordinates. An induction motor runs with slip, so its rotor trails the magnetic field by a load-dependent few per cent. A small speed error can send the analysis to the wrong part of the spectrum. Recovering those coordinates from the electrical recording has produced enough failure modes for a separate post. The result is a compact set of physics-derived features: measurements that give the model specific evidence to assess.
Third: we did not have a representative labelled fault dataset. Tolstoy, of all people, offers a useful analogy: happy families are all alike; every unhappy family is unhappy in its own way. Healthy motors of the same design, tested under the same conditions, give us a useful reference. Real failures are rare, expensive and varied. We could not wait for a library covering every fault and motor type, so we started with a smaller question: does this motor look like the healthy motors we know? In machine learning, this is a one-class problem: learn from a healthy reference population and flag departures from it.
The proof of concept in one picture: the healthy reference motors cluster at lower anomaly scores, while the known-faulty motors shift higher. Two different detector families show a similar separation on this small reference set, using features associated with bearing and alignment faults.
We also use physics-based fault injection to simulate well-known faults and test the pipeline beyond the small set of known faulty motors. By adding controlled signatures to healthy recordings and sweeping through obvious to barely detectable, we can see where detection breaks down. Synthetic faults are not field evidence, but they are useful for finding weak assumptions before deployment.
One-class learning has sharp edges of its own. We are defining normal from a modest number of healthy units, in a feature space large enough to mislead us. In practice, a false positive can be as damaging as a missed fault: a station that repeatedly rejects good motors will be switched off. We chose statistical models whose results we could inspect and challenge on motors they had not trained on. Careful feature design, held-out testing and interpretable scores matter as much as raw sensitivity.
The hold-out check exposes the real difficulty. Known-faulty motors separate clearly, but healthy recordings reserved for testing do not reproduce the training distribution perfectly. That gap is why false positives and site-specific baselines became central to the project.
In the end, the signal-processing pipeline is only half the problem. A useful system needs two things:
! Trust. Engineers need to understand why a unit was flagged, so the score remains tied to a physical mechanism and frequency.
! Data. A model's ability to generalise depends on what its training data represents. It needs diverse examples, and the rare fault examples need credible labels.
That led us to a slight pivot.
05
A small pivot
We began with predictive maintenance in the field: watch motors over time and warn before failure. The proof of concept showed that the electrical signal carries useful fault information. It also exposed what stood in the way of a general purpose Predictive Maintenance product: every installation differs in load, cabling, grounding and noise, so a model trained in one place can move out of distribution in the next. Real faults are rare, and when one appears it is seldom labelled with enough confidence to improve a model.
We needed repeated measurements under known conditions, with someone qualified to investigate the unusual ones.
An end-of-line quality-assurance station offered exactly that. The same model, the same pipeline and the same physics suddenly operate in a much better learning environment. The test load and electrical conditions are controlled. Most units are healthy, so a reliable local baseline can be built quickly. When the detector finds something unusual, an expert is already there to inspect it, and crucially, label it.
At the test station, we have:
! Trustworthy baselines, data collected at scale at the beginning of each motor's life.
! Consistent measurements, taken under a controlled test procedure rather than an unknown field condition.
! Expert labels, created when a technician investigates a flagged unit and records the final judgement.
Because training needs only healthy units and a few minutes from each, the line learned its own factory-specific baseline on site in an afternoon. The trained model was validated against the factory's own healthy population, with no fault library, no cloud dependency and no data scientist required on the floor.
Our QA system is running today on a partner's production line at a European commercial-kitchen-equipment manufacturer. On this line, the final quality gate entailed an experienced technician literally listening to each unit. The detector now listens alongside them, and clean passes produce an algorithmic quality certificate. The workflow is designed to make disagreements useful. If the detector flags a unit the ear would pass, the technician can re-inspect it and record the outcome. A production line mostly builds healthy motors; an expert's assessment is what can turn an unusual recording into a useful labelled example.
The app, machine learning and data management all run on a small edge computer at the test station. Every test is archived losslessly in the same format our research notebooks use. The technician's final judgement stays attached to the recording. When connectivity is available, recordings sync to the data lake; when it is not, QA continues independently.
The data we've collected from it are already useful: they have helped us improve the analysis and check changes against earlier results. The station is doing useful work while building the reference data and expert-review process that predictive maintenance needs.
The immediate application changed, but the question did not: does this motor look healthy? Moving that question to QA turns a hard data-collection problem into part of an existing production task.
The operator view, shown here in test mode. The technician starts the test, records the sound assessment and reviews the electrical result before assigning the final label.
Every clean pass produces a quality certificate linked to its recording. The example shown is a test specimen.
06
From detective to predictive
This sets up a self-improving flywheel:
1. QA establishes a baseline at birth. Every tested motor can leave the line with a high-quality electrical fingerprint from the start of its life.
2. Expert review turns anomalies into labels. The technician's judgement converts a machine alert into evidence we can use.
3. Labels improve diagnosis. As confirmed examples accumulate, the system can move from "anomalous" towards a named mechanism and an estimate of severity.
4. Fleet histories enable prognosis. Measurements gathered later in service can connect the birth baseline to the motor's actual degradation path and, eventually, to remaining useful life.
Each step strengthens the next. More QA stations can add motor types, operating points and expert assessments. Our aim is to use those examples to build models that generalise across motor designs and sites. Proposed model improvements need to prove themselves on motors outside their training data before returning to the stations. That closes the loop between measurement, expert review and better analysis.
Alongside that shared learning, we want to follow individual motors in service. If measurements from Zero-equipped installations can be linked to their factory records, those baselines provide a starting point for tracking degradation. Their service histories would add evidence about how motors age under years of changing loads. Shared models and individual histories together are the route from a useful one-class detector towards prediction.
Motor diagnostics is also only one use of the electrical stream. Voltage and current together can reveal energy waste, power-quality problems and equipment operating away from its best-efficiency point. Those are separate products to validate, but they draw on the same measurement infrastructure.
This is where Zero matters strategically. A measurement point inside the power infrastructure can collect earlier, more consistently and across far more circuits. The strategic advantage comes from where the data originates, how often it arrives and whether it comes back with a trustworthy label.
The lesson from this project is that data collection and expert feedback need to be designed into the product. The QA application makes both part of a useful engineering task today, while giving us a way to build towards predictive maintenance.
The whole strategy begins with a device you already use in a cabinet you already have.
If you build motors, operate critical motor systems or work on the data problem behind predictive maintenance, let's compare notes.
References
- W. T. Thomson and M. Fenger, "Current signature analysis to detect induction motor faults," IEEE Industry Applications Magazine, 2001.
- R. R. Schoen, T. G. Habetler, F. Kamran, and R. G. Bartheld, "Motor bearing damage detection using stator current monitoring," IEEE Transactions on Industry Applications, 1995.
- M. E. H. Benbouzid, "A review of induction motors signature analysis as a medium for faults detection," IEEE Transactions on Industrial Electronics, 2000.
- P. J. Tavner, "Review of condition monitoring of rotating electrical machines," IET Electric Power Applications, 2008.
- H. W. Penrose, Electrical Motor Diagnostics, 2nd ed., Success by Design, 2008.
- Siemens / Senseye Predictive Maintenance, The True Cost of Downtime, 2024.